
The Health and Medical Geography Specialty Group (HMGSG) is pleased to announce the Health Data Visualization Contest. We offer monetary awards for winners. The contest deadline is usually in January. Winners will be announced at the HMGSG Business Meeting.
What to Submit
A spatial data visualization offers insight into some health or medical geography topics. It could be a static graphic, an interactive web page, a narrative or story-telling map, etc. Your visualization can focus on one topic in detail or facilitate the exploration of multiple associations. No maps are required, but the data you visualize should have some spatial component. We offer two awards for this contest—one for a static visualization and one for a dynamic and/or interactive visualization.
Details
Requirements
- Individual or team submissions are accepted, but at least one person should be an AAG member. Individuals can only be listed on one submission.
- Health-related data must come from you or your team or be based on publicly accessible secondary data.
- The submission should contain one graphic element or a composite of multiple graphics that are meant to be viewed as a single visualization (e.g., data dashboard)
- The visualization must incorporate some spatial aspect or feature of the data.
- If clinical or personal health information is used, data must be de-identified with no way of tracing back to individuals.
Submission Protocol
- Submit using this form (https://forms.gle/CdP6SSNSdjkKyUDS7)
- Submissions should be submitted as a file (pdf, png, etc.) or link (URL, GitHub page, etc.). A short (< 300 words) description should also be included.
Important Dates
- Submission Deadline: ~January
- Winners Announced: HMGSG Business Meeting
Awards
- $100 static, $100 dynamic
- Winners will receive a certificate at the HMGSG business meeting
Any questions can be directed to TBD.
2026 Award Winners
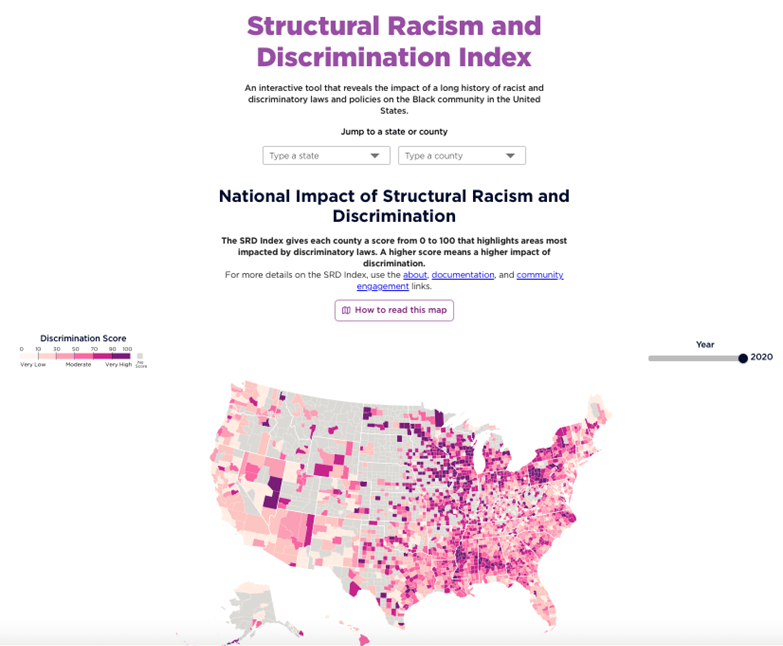
Structural Racism and Discrimination Index
Debs Ghosh, Sabina Bhandari, Cheryl Knott, Zev Ross
University of Connecticut, University of Maryland Baltimore County, ZevRoss Spatial Analysis
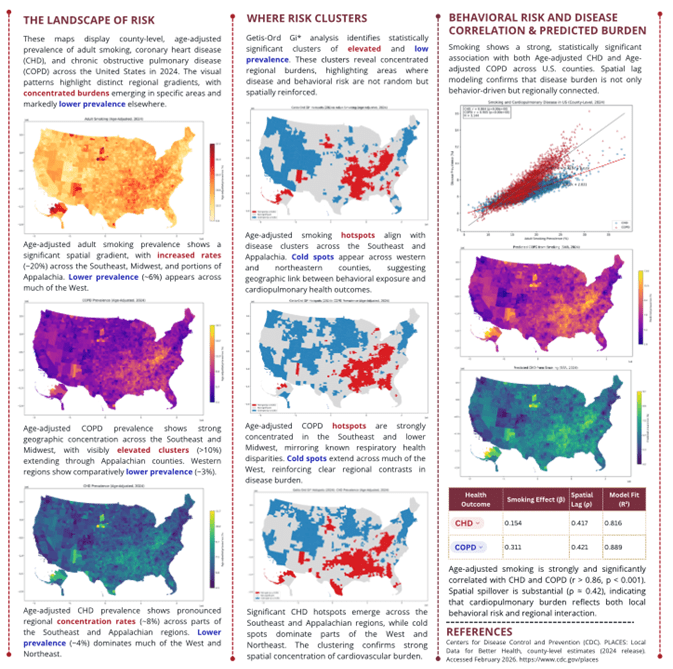
Where Smoking Persists, Disease Follows
Stephen Liwur, Florida State University
2025 Award Winners
India Policy Insights: A Spatio-Temporal Visualization Platform for Health and SDOH Data
SV Subramanian, Devika Jain, Joaquin Kachinovsky, Gonzalo Rodriguez, Junyi Chen, and Rockli Kim
Harvard University

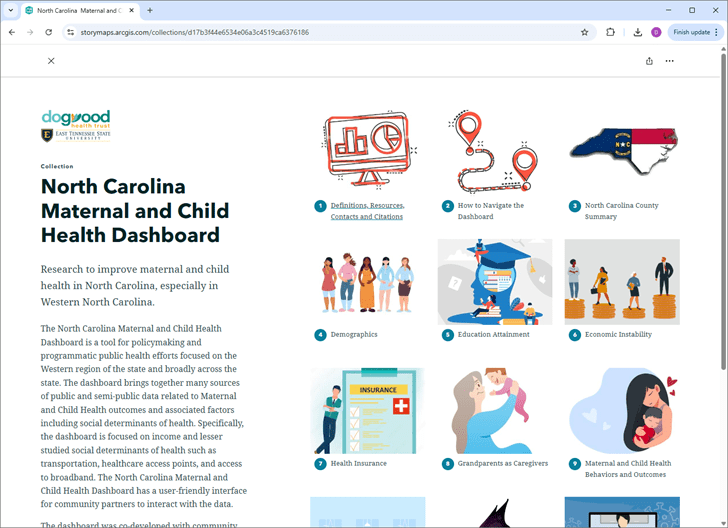
North Carolina Maternal and Child Health Dashboard
Qian Huang, Matthew Beer, Liane Ventura, Kate Beatty
East Tennessee State University
—————————————————————————————————————————–
2024 Award Winners
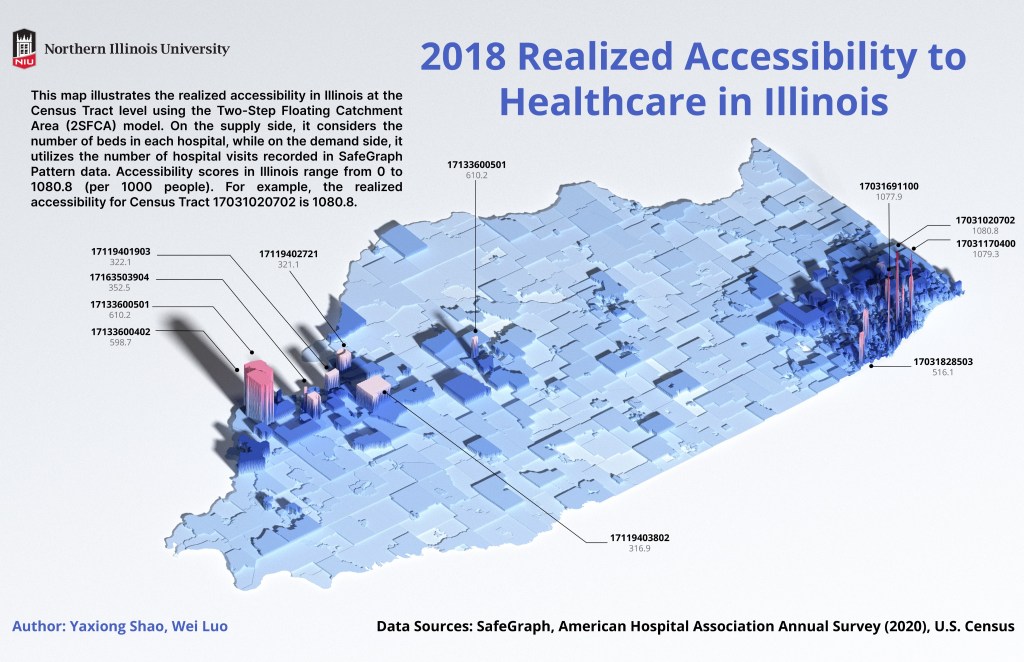
The static map winners: Yaxiong Shao & Wei Luo
2018 Realised Accessibility to Healthcare in Illinois
The dynamic map winners: Wei Chien Benny CHIN , Chen-Chieh FENG & Yi-Chen WANG
Visualizing Healthcare Accessibility in Singapore
The link to the map https://wcchin.github.io/sg_health_access/
2023 Award Winners
The static map winners: Kylie Yuet Ning Poon & Cathy Tung Yee Tsang.
“An Exploration on the Relationship Between Sugar-Sweetened Beverages and Diseases in the United States”
Dynamic map winner: Guinan Guo
“Visualizing population point density by race/ethnicity in the United States.”
2022 Award Winners
Dynamic Mapping Group
Title: Lyme and Tickborne Disease Dashboard
Frank C. Curriero, Cara Wychgram, Alison W. Rebman, Anne E. Corrigan, Anton Kvit, Timothy Shields and John N. Aucott
Title: Community-Level Maltreatment Risk in Texas; A Web-Based Data Dashboard for Communities
Dorothy Mandell, Molly O’Neil, Mohamad Karimifar
2021 Award Winners
Static mapping group
Title: Spatial Network of Cancer Care Utilization and Automated Delineation of Cancer Service Areas in Northeast US
Team: Changzhen Wang, Fahui Wang, and Tracy Onega — Louisiana State University

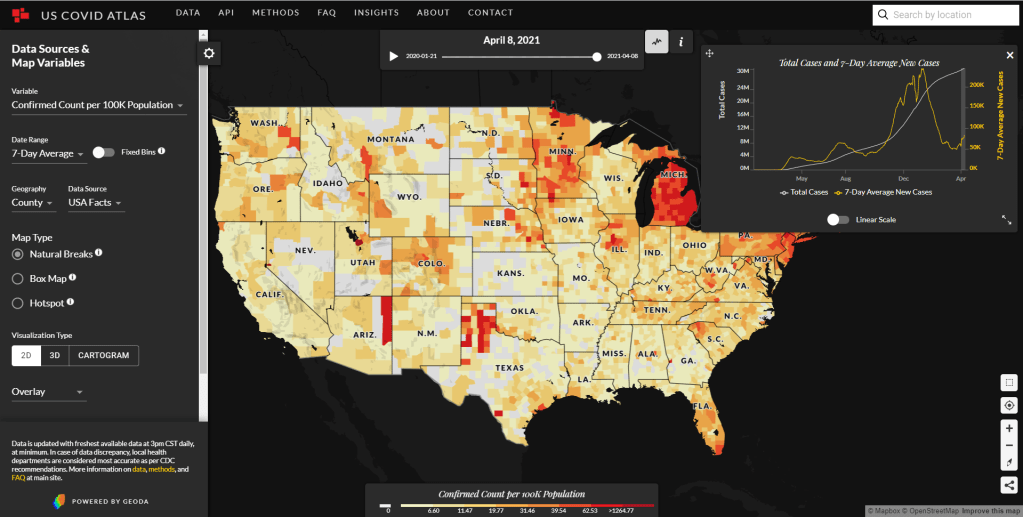
Interactive mapping group
Title: The US COVID Atlas
Team: Dylan Halpern, Marynia Kolak, Qinyun Lin, Vidal Anguino, Susan Paykin, Xun Li — University of Chicago
Website: https://uscovidatlas.org/
Honorable Mention
Title: Housing is a Health Issue! Can We House Those Experiencing Houselessness?
Team: Feminist Mapping Collective: Elsa Noterman, Luke Leavitt, Meghan Kelly, Alicia Iverson, Kela Caldwell, Kallista Bley

2020 Award Winners
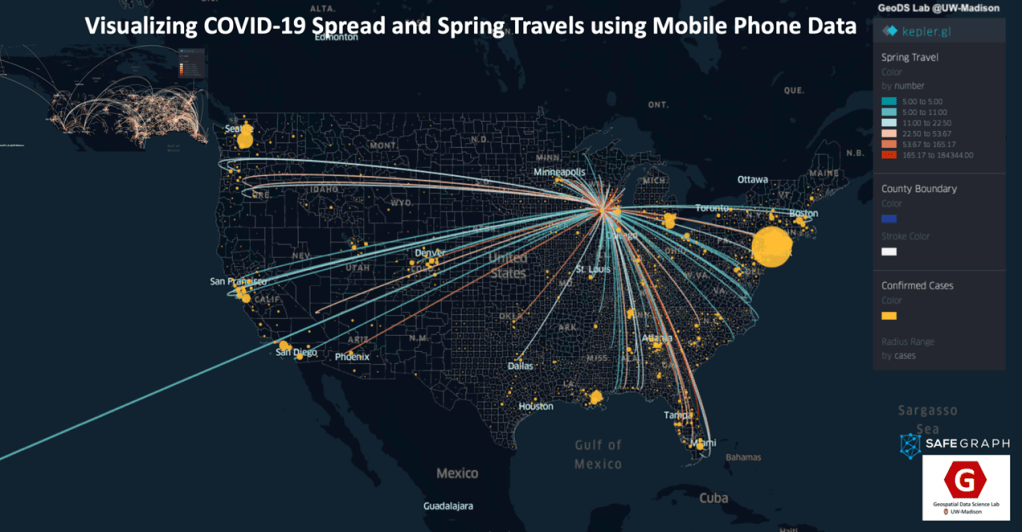
Static mapping group
Title: Visualizing COVID-19 Spread and Spring Travels using Mobile Phone
Data
Team: GeoDS Lab@UW-Madison led by Dr. Song Gao
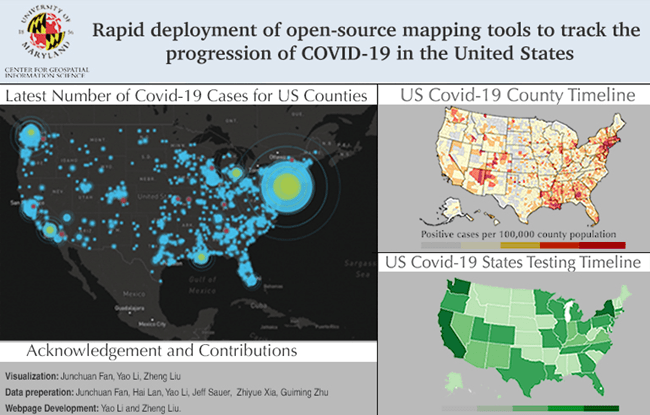
Interactive mapping group
Title: Rapid deployment of open-source mapping tools to track the progression of COVID-19 in the United States
Team: CGIS @UMD – Junchuan Fan, Yao Li, Zhiyue Xia, Hai Lan, Guimin Zhu, Jeffery Sauer, Zheng Liu
Website: https://mgzjys.github.io/US_Covid19_Index/
2019 Award Winners
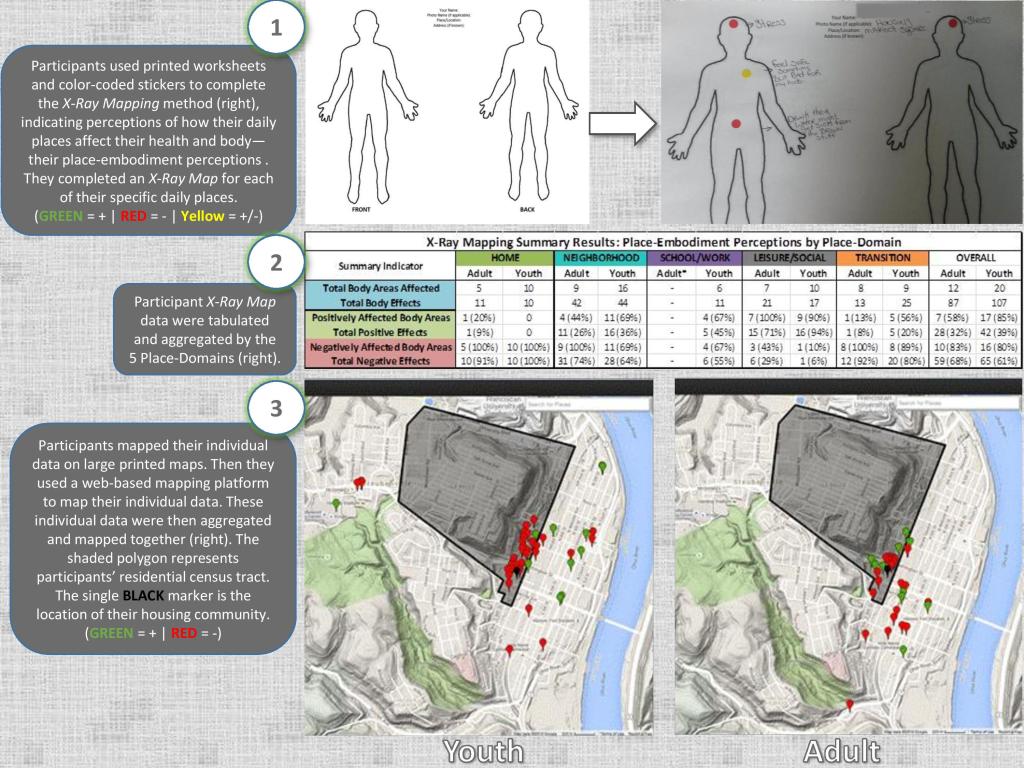
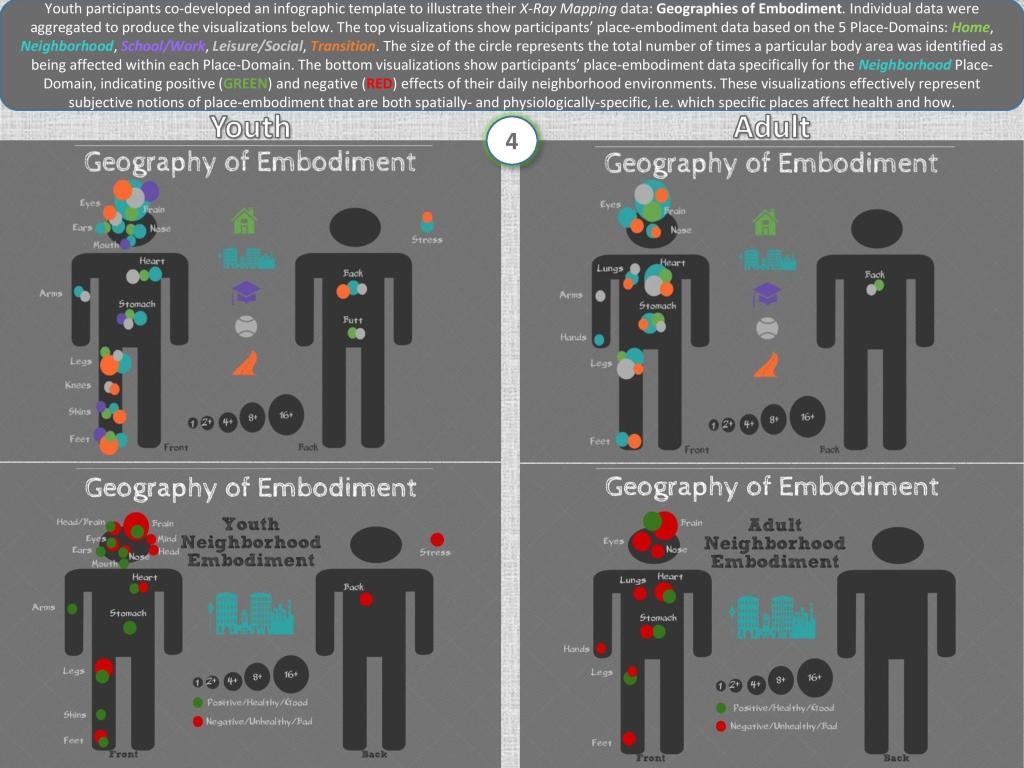
Static mapping group
Team: Ryan Petteway from Portland State University
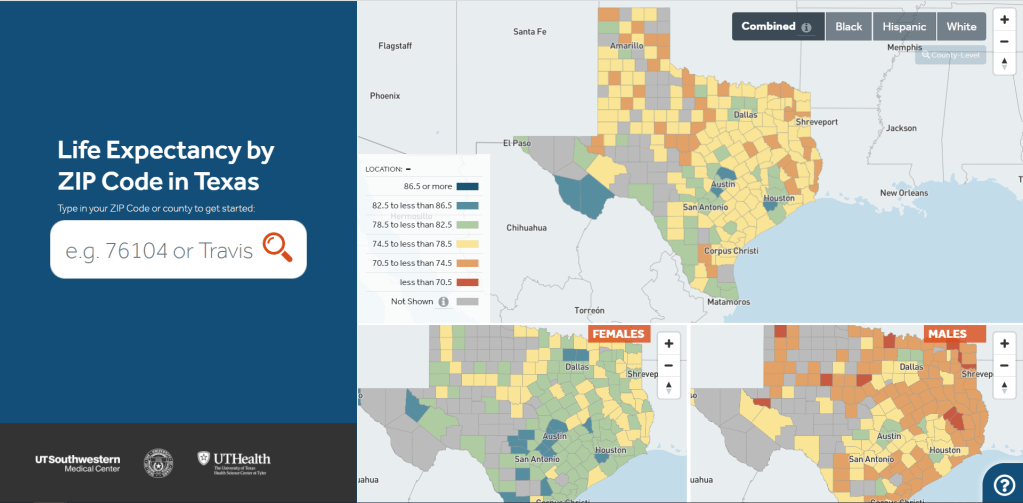
Interactive mapping group
Website: https://www.texashealthmaps.com/lfex
2018 Award Winners
Winning Submission
Title: Visualizing Preterm Birth in Fresno County, CA
Team: Marta Jankowska, Jay Yang, and Jessica Block
Website: https://delphidata.ucsd.edu/ptbi/ui/home/

First Runner-Up
Title: Smoking Mapped
Team: Casey Kalman and Meghan Kelly
Source: https://drive.google.com/file/d/1fB92oTN3nftS792gurrglHGSeIOx1fDa/view
